

The US Exceptionalism Overhang
Foreign flows into the US were never "exceptional," suggesting the overhang is small

As I discussed in a recent post, a key debate in markets currently is whether Dollar weakness is cyclical, i.e. temporary, or whether it reflects more structural factors that will pull the Dollar down over the medium term. If it’s the former, there’s still the issue how big a temporary fall might be. That question depends on how big foreign inflows into the US have been in recent years, as the myth of US “exceptionalism” attracted inflows. That positioning overhang in turn determines how big potential outflows - and associated Dollar weakness - might be.
Today’s post looks at this “exceptionalism” overhang using US Treasury data on foreign flows. The bottom line is that there is nothing exceptional about foreign inflows in recent years. The positioning overhang is small, which means that - if this is the source of Dollar weakness - it’s likely mostly played out.
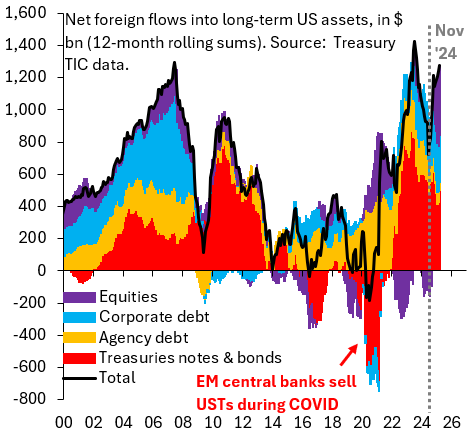
The chart shows US Treasury TIC data, which cover monthly net inflows into different US assets by foreign investors. These data come out with a substantial lag. March 2025 data were published only yesterday, which means they’re largely ignored by markets. But even stale data can be useful every once in a while and now is one of those times. That’s because the “exceptionalism” overhang depends on past inflows, which are well-covered in these lagging data. The chart shows that foreign flows into US stocks (purple bars) only really got going after the election and are thus VERY recent. That makes it likely that this driver of US stock market weakness has played out. Foreign flows into corporate debt (blue bars) have been more sizeable, but they’re again modest compared to past, large foreign inflow episodes like in the run-up to the 2008 global financial crisis. The bulk of foreign inflows recently has been into US Treasuries (red). A substantial portion of those inflows reflect foreign central banks rebuilding Treasury holdings after a large drawdown during COVID as they intervened to support their currencies. Overall, the US “exceptionalism” overhang looks modest. It’s therefore likely that this source of Dollar weakness has played out.
Of course, these TIC data don’t capture all foreign inflows into the US. In the balance of payments, they correspond to foreign portfolio inflows, i.e. shorter-term flows into US stocks and bonds, and therefore don’t capture foreign direct investment flows into real estate, for example. But the point here is that the TIC data do capture more liquid inflows, which are most likely to exit as the “exceptionalism” bubble bursts. They are - in my opinion - a good representation of how big the relevant positioning overhang in US assets is. It just isn’t big.
Should we be looking only at recent foreign equity inflows to gauge vulnerability to a US exceptionalism unwind? Should we not be looking at the ~$19T / 20% stock of foreign ownership of US equities? Of course reversals of this largely real-money held stock should exhibit more of a long-term, slow-burn unwind (As opposed to the rapid-capital-outflow narrative associated with April market volatility)