Peak Dollar Strength
The Dollar is currently much stronger than meets the eye

Thank you for subscribing to my posts. If you’re not yet a paying subscriber, please consider becoming one. That’ll allow you to DM me with questions and comments. I plan to move my posts behind a paywall in coming months. Subscribing now locks you in at a low rate. Thank you so much for your support and feedback!
The fact that the Dollar has risen so much since the Fed meeting on June 17 is even more impressive than meets the eye. That’s because President Trump signed the deal to end the war with Iran that same day. Whenever there’s been signs of de-escalation in the war with Iran, the Dollar has tended to fall, so - whatever Dollar-positive force the Fed unleashed - it’s more than offsetting the global pick-up in risk appetite that ordinarily would be weighing on the Dollar.
Markets are currently as bullish on the Dollar as I’ve seen in a long time. A lot of this optimism is in my view built on sand, because the recent Fed meeting wasn’t nearly as hawkish as everyone seems to think. Oil prices have been tumbling, which is going to pull down inflation in coming months. That’s not an environment where the Fed can or should hike. As I’ve flagged in recent posts and in Saturday’s live stream, there’s no sign underlying inflation is running out of control. All this means we’re currently at peak Dollar strength. The Dollar should fall from here.
Today’s post reviews recent Dollar price action and looks at positioning using data from the CFTC’s Commitments of Traders (CoT) report, which covers trading in FX futures on the Chicago Mercantile Exchange (CME). These data capture at most five percent of the global FX market, so they’re a small slice of a much bigger picture. That said, in my experience they’re a good representation of what the broader market is doing. According to these data, markets are currently max long the Dollar, which in my mind adds to the case for Dollar weakness in the remainder of 2026.
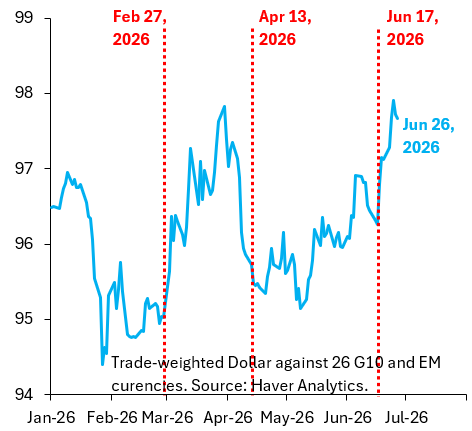
The blue line in the chart above shows the trade-weighted Dollar against seven advanced economies and nineteen emerging markets. This is the broadest possible way to look at the Dollar and mimics the Fed’s broad Dollar index. The three vertical red lines denote key turning points in the war - the day before the war began (Feb. 27) and the day the US blockade of Iran started (Apr. 13) - and the day of the most recent Fed meeting (Jun. 17). What’s clear is that - whenever the war with Iran escalates - the Dollar rises as global risk aversion spikes and global markets look to the US for safety. When prospects of a peace deal rise, the Dollar falls as global markets exit the US safe haven. In line with this pattern, President Trump’s signing of the peace deal on Jun. 17 should have seen the Dollar fall, but that didn’t happen. Whatever hawkish impulse the Fed gave to markets totally swamped what should have been a “risk-on” fall. Given all the ambiguity around Kevin Warsh’s first FOMC meeting as Chair, I see this as a sign markets are grasping at anything for an excuse to be long Dollars.
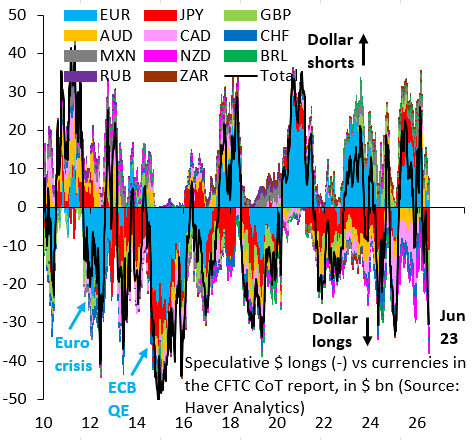
The black line in the chart above summarizes net positioning against the Dollar across the world’s major currencies. When that line is negative, as it is now, markets are long the Dollar across the board. In the most recent reading - for Jun. 23 - markets are almost as long the Dollar as in 2012 at the height of the Euro zone sovereign debt crisis or in 2014 when the ECB and BoJ were easing. Dollar long positioning is very stretched in other words. I see this as another reason why we’re at “peak Dollar.” This kind of extreme positioning is setting markets up for disappointment.
There’s a view on the market that we might not have 2 rate hikes but at least one (which is what the market is pricing right now) given the increase in prices of the chips and that the focus on inflation is now on this and no longer in oil prices. What’s you view on this? I pretty much agree with you on the thesis that the fed wont hike.
You mean the regime that keeps declaring a fake victory to manipulate markets on Mondays while the strait remains closed except for IRGC and Chinese traffic? This was supposed to be a few weeks and we’re three months in without an agreement in sight. This is a spectacular blunder.
Anyway, IMO this chart is not so much dollar strength as its Euro and Asian weakness in the global energy supply crisis.
This is also allowing China to experiment with ways to avoid the dollar in trade, especially with BRICS; though my concern about that is more mid and long term.